The Biodiversity Matrix – a database of contemporary distributions and drivers of freshwater biodiversity
One way of answering the question “What is the Biofresh project trying to do?” is to say that we are striving to create a functional data ecosystem that will enhance our ability to understand and conserve freshwater biodiversity. Part of this task involves creating connection points where related forms of data are assembled into a functional whole (in a scientific and policy sense). One such connection point is the Biodiversity Matrix or “BioMatrix” being developed by Dr Savrina Carrizo and Dr William Darwall at the IUCN Global Species Programme Freshwater Biodiversity Unit in Cambridge, UK.
In essence, the BioMatrix is an interoperable database of contemporary distributions and drivers of freshwater biodiversity mapped to key spatial frameworks used for scientific analysis and for policy and planning. The BioMatrix will primarily map data to the new HydroSHEDS catchments because these provide a multi-scale, global standard of ecologically meaningful spatial units. However, if cross-mapping proves feasible it will also be possible to extract and map data for other spatial units such as Natura 2000 sites and Water Framework Directive (WFD) reporting units.

Conceptual overview of the BioMatrix database
Commenting on the significance of the BioMatrix, lead developer Savrina Carrizo believes that “Once assembled, the BioMatrix will save scientists an enormous amount of effort in data preparation as the species distributions, their conservation status and environmental data have all been compiled and mapped to a common spatial framework. This will enable scientists to focus on extracting the data of interest and running their analyses.
For those seeking more policy visibility for freshwater biodiversity, the BioMatrix itself will help highlight the knowledge gaps in the conservation status and distribution of freshwater species and promote investment in filling these gaps. Among numerous applications, the BioMatrix can be used to show where freshwater species distributions overlap with threatening processes, helping to inform decision-makers.
The BioMatrix is due for release in October 2012. It will support the science being conducted under several Biofresh workpackages and summary maps will be generated from the BioMatrix for the forth-coming Biofresh Atlas of Freshwater Biodiversity. The BioMatrix is conceived of as a ‘working’ database that will be developed beyond October 2012 as new data become available from IUCN mapping initiatives and other initiatives.
The data that will be included in the BioMatrix
Geographical coverage – The database includes areas where IUCN freshwater assessments have been completed and mapped to date. As further areas are completed, the data will be incorporated in the BioMatrix.
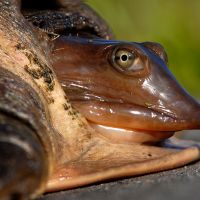
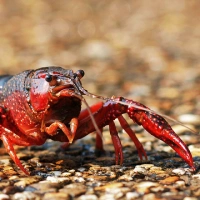
Species coverage – Species include freshwater birds, mammals, amphibians, crabs, crayfish, fish, odonata, molluscs, reptiles, turtles, shrimps and aquatic plants. A preliminary version of the BioMatrix dataset comprises data on the global distributions of 13,500 freshwater species across six taxonomic groups (i.e. 462 crayfish, 87 aquatic reptiles, 3263 aquatic amphibians, 8870 freshwater fishes, 699 aquatic birds, and 119 aquatic mammal species). Throughout 2012, new species distributions will be mapped by the IUCN team and these will be added to the BioMatrix as they become available. The threat status of each species is sourced from The IUCN Red List of Threatened Species™.
Environmental data coverage – The environmental data relate to climate, topography, hydromorphology, geomorphology, land cover, ecology and human demography. Other layers could include the CVI which is being developed in BioFresh Work Package 5.
Species distributions – Distributional data is based on species presence and summaries based on diversity metrics such as species richness and threatened species richness will be available.
Spatial units – The core spatial framework of the BioMatrix is the HydroSHEDS catchment layer. Other spatial units, such as WWF freshwater ecoregions, Key Biodiversity Areas (KBAs), Natura 2000 sites and Water Framework Directive (WFD) reporting units, will also be considered for addition if cross-mapping from HydroSHEDS is found to be feasible.


