SOLUTIONS for open-data publishing
![]()
Guest post by Steffen Neumann, David López Herráez and Werner Brack.
Since the earliest days of science, journal articles have been the centre of scientific communication. They are the source of information in which academics, policy makers and businesses know what is happening in – and can build upon – the important research in their field. With online publishing, scientists can now collaborate more than ever before, sharing not just brief overviews of their methodology and results in print articles, but also their full results, primary datasets and even interactive graphics, all as “supplemental data”.
Supplemental data may help make scientific research more reliable (as experiments can be easily and properly replicated and fact-checked), efficient (as similar datasets are shared across different users, rather than having to be created multiple times from scratch), and democratic and transparent (as expert statements are open to public scrutiny). Despite this, it can sometimes seem like authors, editors and reviewers currently neglect the huge promise of supplemental data.
This was one of the topics under discussion at last month’s second annual general assembly of the SOLUTIONS project. This EU funded project is an international collaboration of academics, policy makers and businesses, all working to solve the problems of chemical pollution in European rivers and lakes. Getting the most out of the relevant science is a hugely important aspect of SOLUTIONS’ work, and one in which good supplemental data could play a vital role.
After discussion at the recent general assembly, SOLUTIONS members Maria König, Miren López de Alda, Bozo Zonja, Francesco Falciani, Steffen Neumann and Tobias Schulze created a report entitled “What makes good Supplemental Data and how to get there?” The report gives the following advice to scientists on using supplemental data to create better science that can be used more effectively to support environmental protection.
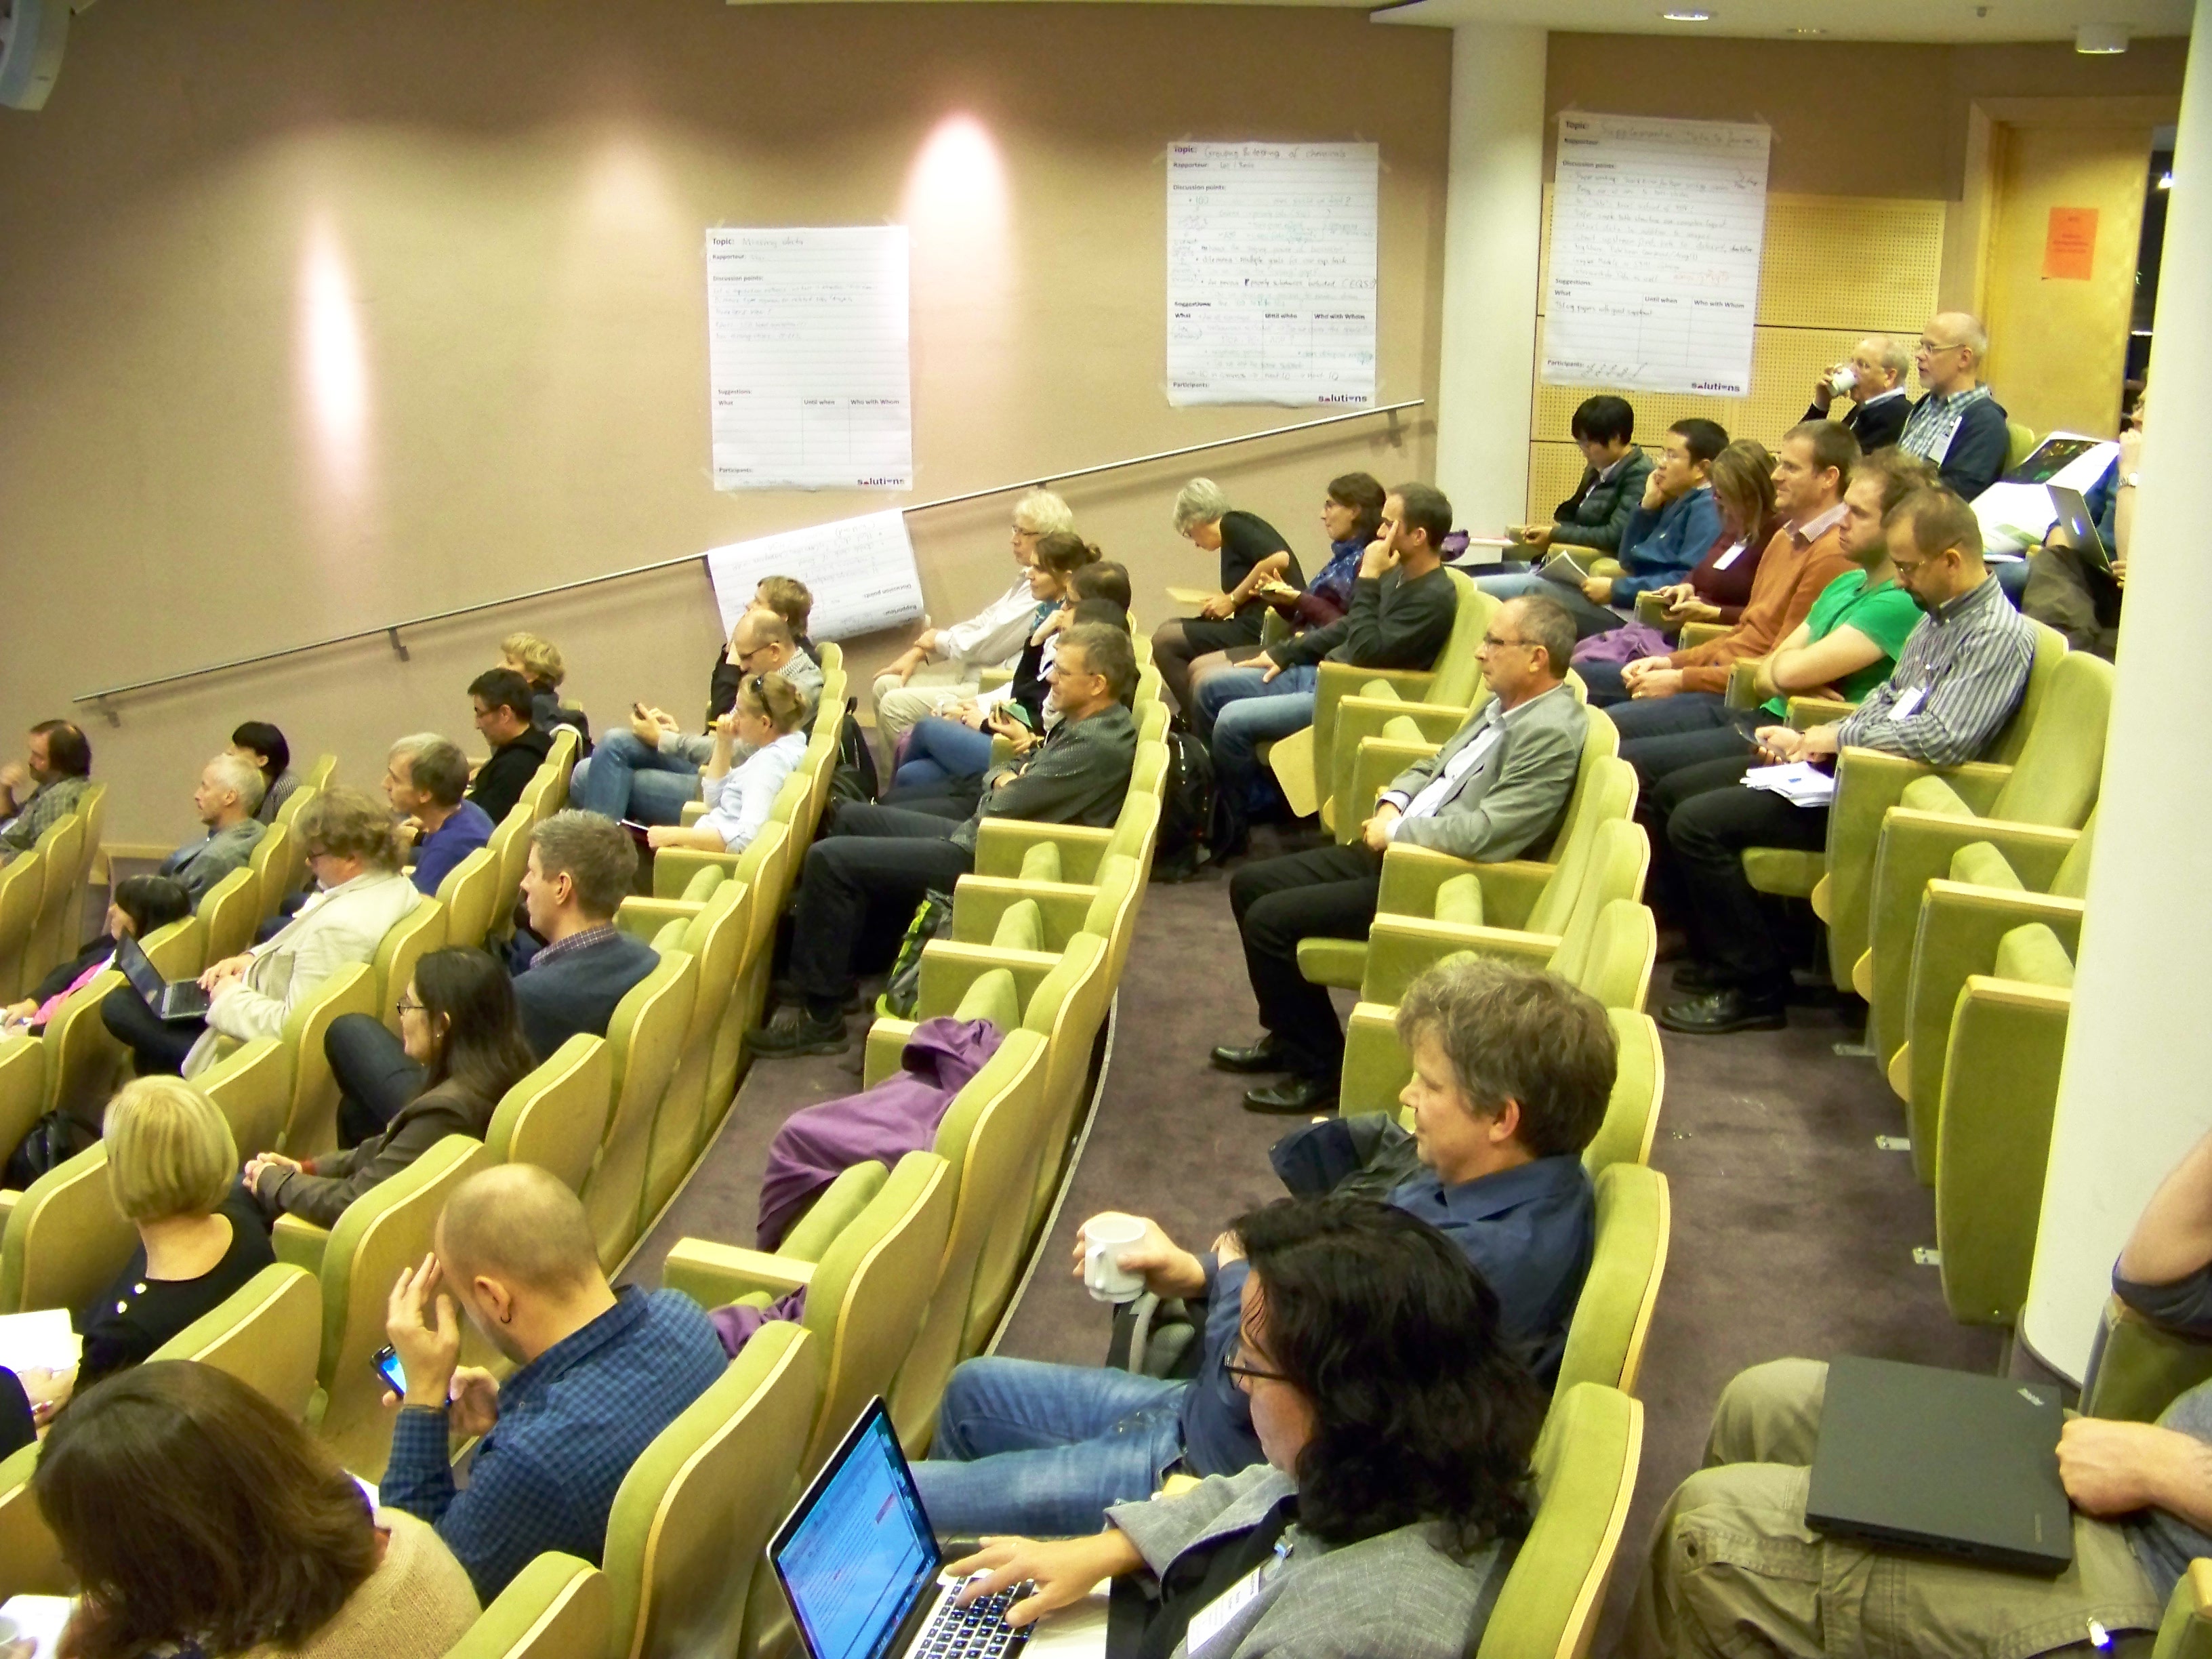
Attendees at the SOLUTIONS general assembly. Image: SOLUTIONS
Who uses supplemental data, and for what?
Perhaps one of the original aims of supplemental data was to add supplemental information that would not fit into the prescribed, say, eight pages of the main manuscript. In essence, these types of supplemental information are like an extension to the paper.
An important example of an area where supplemental data can really shine is meta-studies. These syntheses rely on being able to extract information from scientific studies in an efficient way. This could mean a lengthy process of contacting dozens of authors to obtain the required data. With good supplemental data, however, access can be instantaneous – making meta-studies not only better scientifically, but also cheaper and more efficient.
Another example is people searching for the best available method for a new study. Very often, journal papers report that some method performs this-and-that better than another method, or is faster, or cheaper, or all of these. Good supplemental information allows potential users to be able to make an informed, unbiased comparison of potential research methods.
Supplementary information can also allow a scientific finding to reach relevant audiences beyond the authors’ immediate peer group. A bioinformatics specialist, say, might be able to use the findings of a new chemistry study to create a better model of watershed pollution. However, he/she may not have the actual knowledge of chemistry necessary to make immediate sense of the article. Good supplementary information can provide the background information necessary for interdisciplinary (or even within-discipline) translation.
What is good practice for the use of supplemental data?
If you have any graphs or diagrams in your article, one of the first things you should have in your supplemental data is the actual data your figures are based on. This means someone else can reproduce the same graphics (even if this is only because they want it in another colour!) Spreadsheets or plain CSV files are the best format for this “real data”. Some useful recommendations for suitable archive formats can be found here.
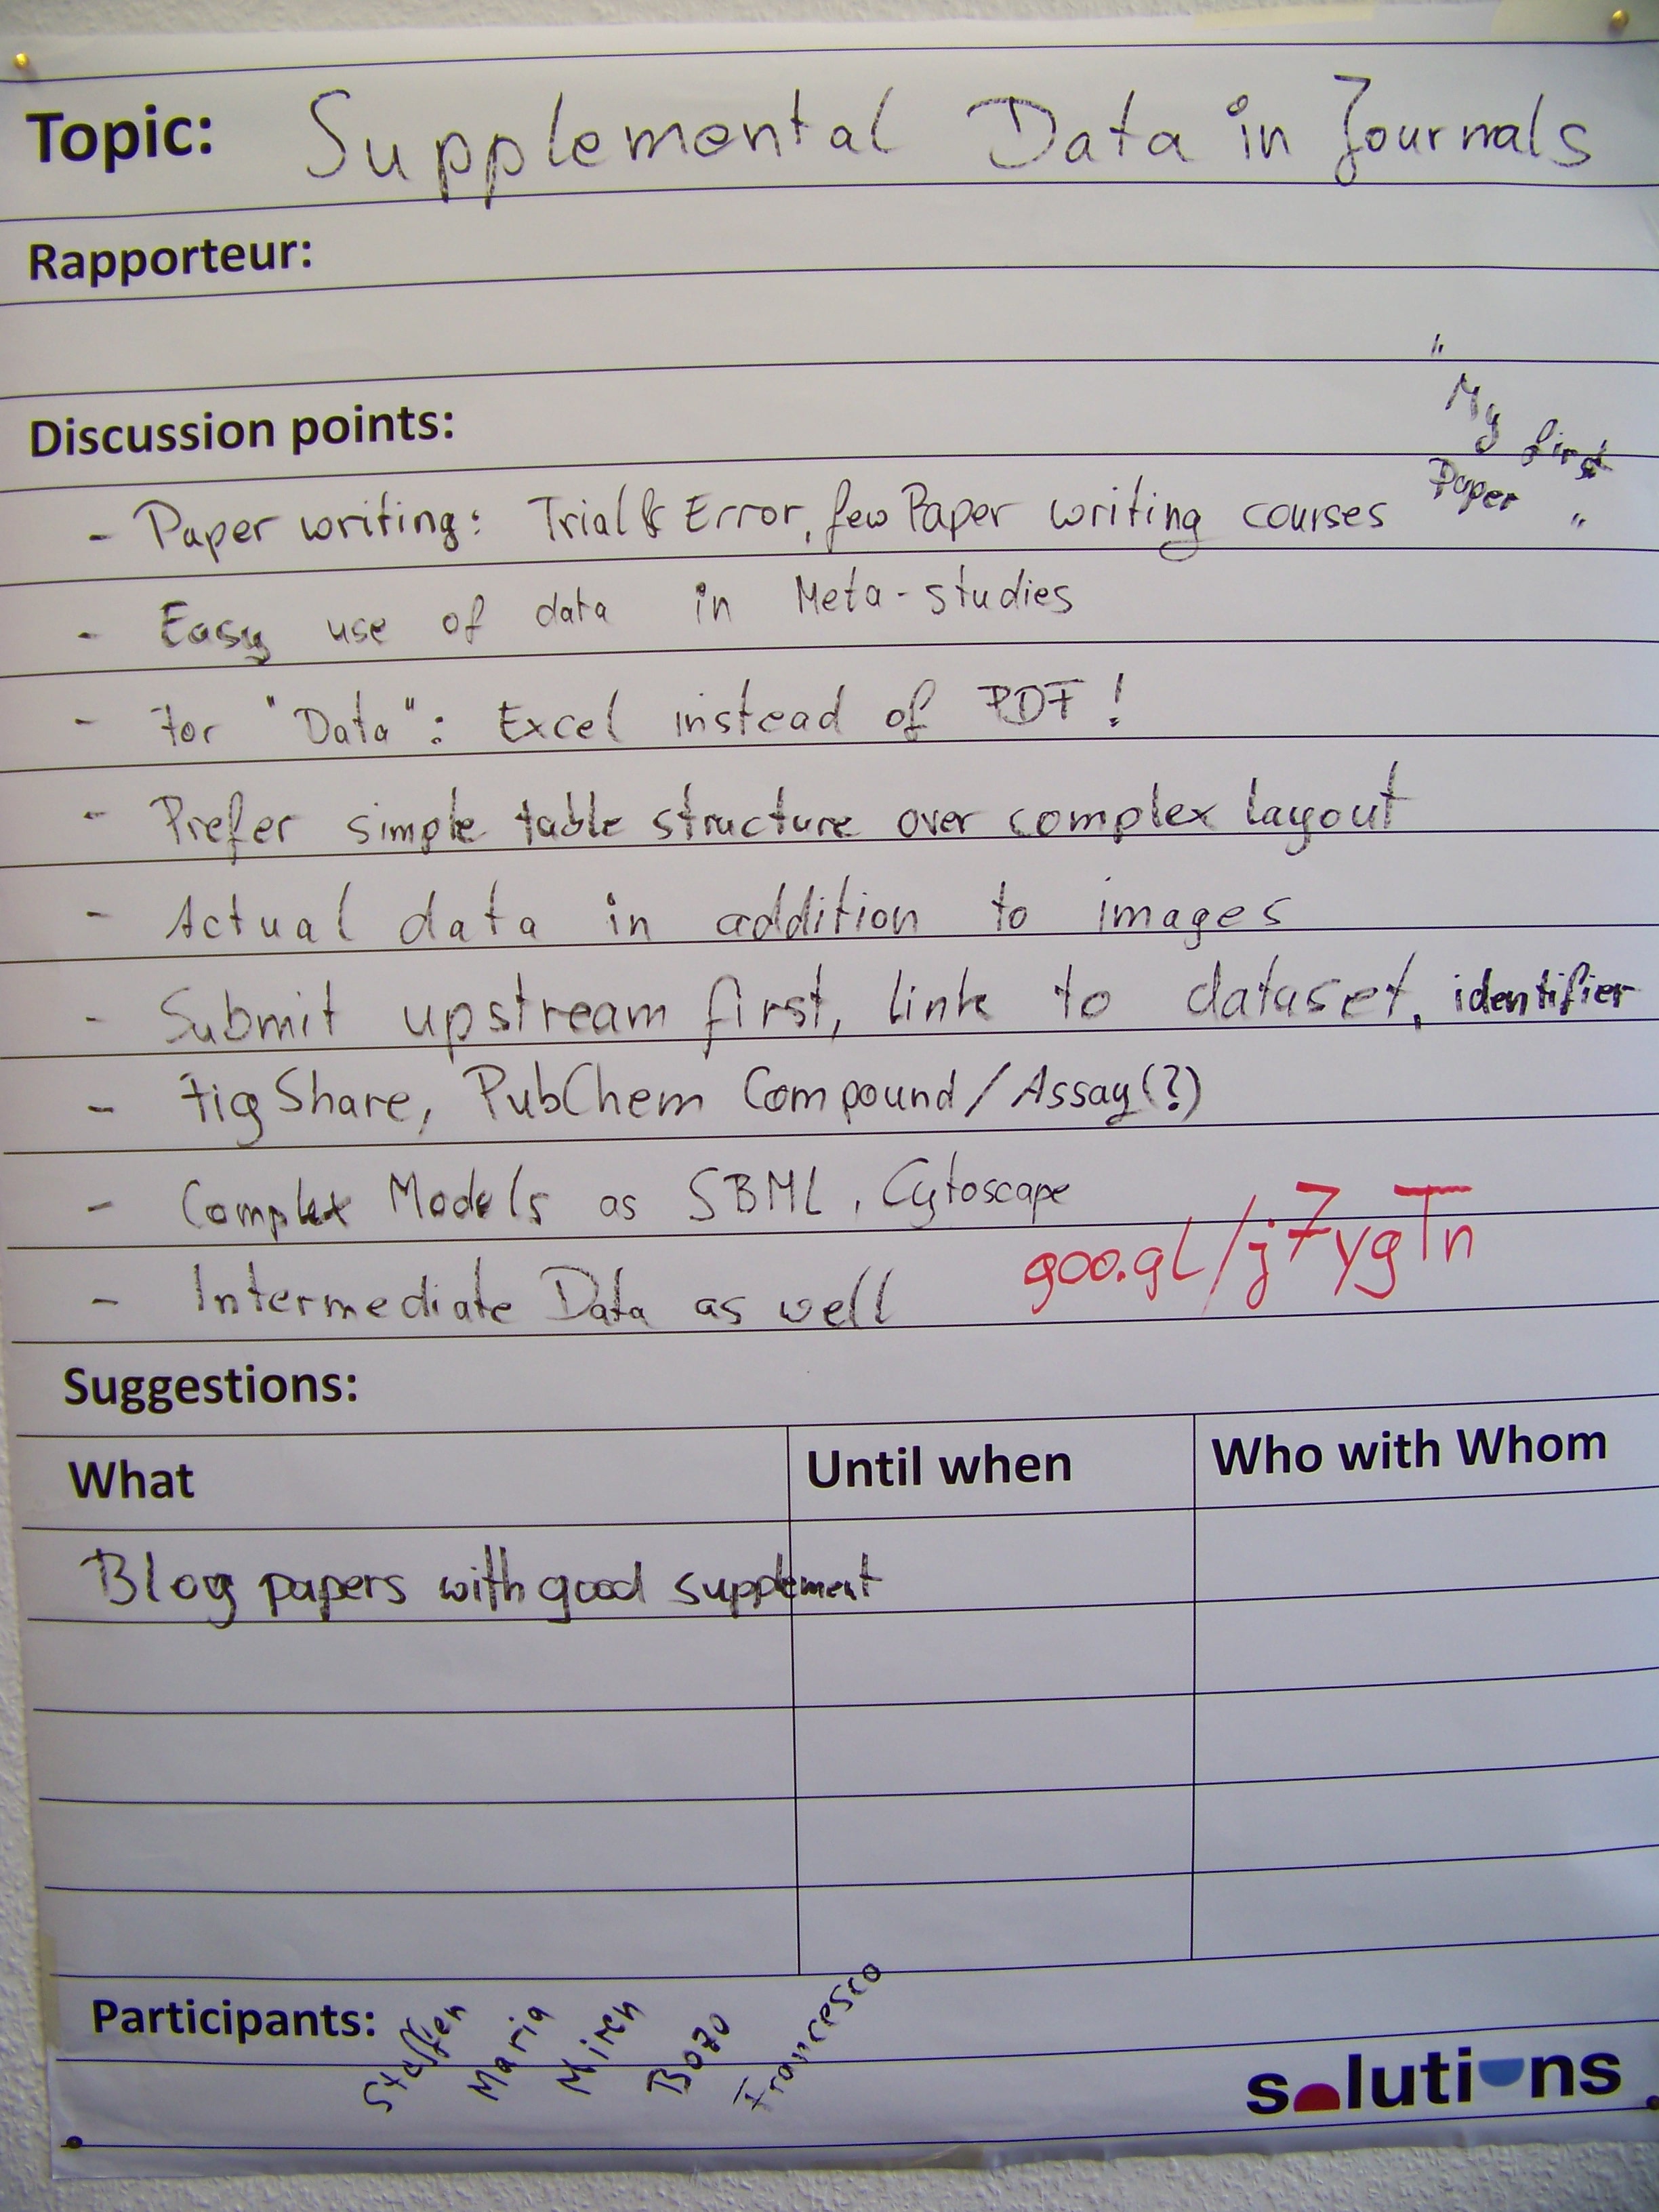 If you’re reporting chemical compounds, you should provide an identifier – not only the name or CAS number. Deriving further chemical and physical properties from a name can be extremely tedious (or impossible) to do it unambiguously. Instead, you can use more detailed identifiers like PubChem CID or ChemSpider CSID, or descriptors like SMILES, InChI, InChIKey. If your datasets are too large for the publishing journal’s supplemental section, there are community-accepted repositories you can use, such as FigShare, Dryad and others.
The new SOLUTIONS report suggests that journal guidelines often give submitters little to no information about what to include in the supplemental data. So how do scientists learn to create good supplemental data?
The report suggests taking note of what works – and what doesn’t – in existing journal articles, and using in-house or departmental peer-review processes to check not just the proposed article, but its supplemental data too. Likewise, based on these recommendations, community advocacy could persuade journals to offer guidelines regarding minimum requirements and/or format their supplemental data should have. As a user-oriented, interdisciplinary project covering a huge range of chemical pollutants across the entire European Union, SOLUTIONS will be working hard to provide best practice examples of how supplementary data can be used to help science work better and faster to protect the environment.


